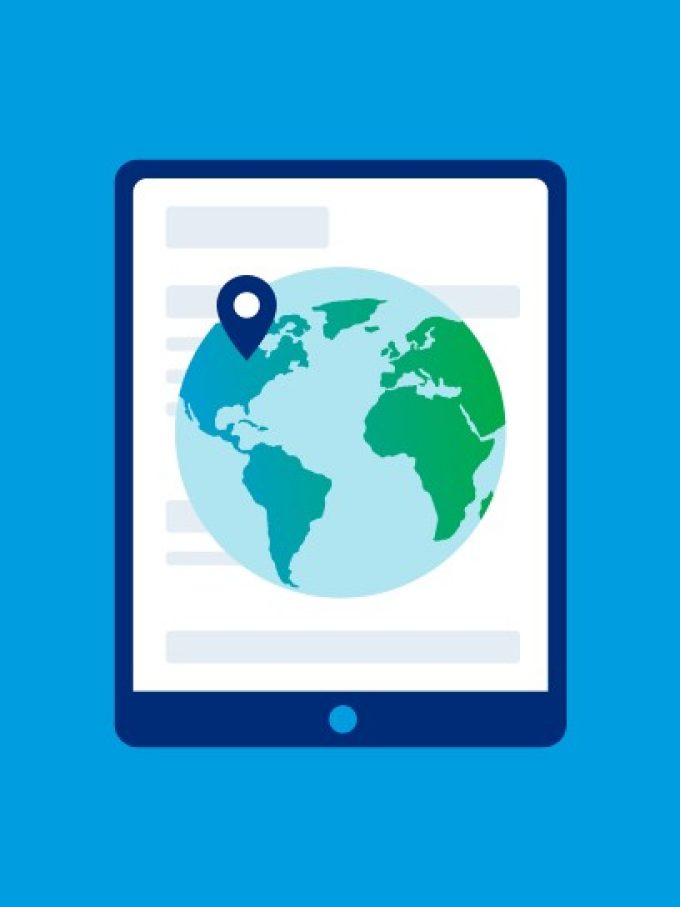
CANADIAN PLAN SPONSORS COULD SEE THE COST OF THEIR DB PLANS INCREASE BY CLOSE TO 20% DUE TO LOWERING RETURN EXPECTATIONS

October 1, 2019

Canada, Toronto


DB pension plans would have to increase their current service funding contributions by close to 20 per cent based on lower expectations of future long-term returns on the asset mix underlying the Mercer Pension Health Index in 2019.


The solvency position of Canadian defined benefit pension plans dropped only slightly in the third quarter of 2019. The Mercer Pension Health Index, which represents the solvency ratio of a hypothetical plan, decreased to 105 per cent on September 30th down from 106 per cent at the end of the second quarter and surprisingly up from 102 per cent at the beginning of the year, despite all-time low long-term interest rates during the quarter. The median solvency ratio of the pension plans of Mercer clients was at 94 per cent on September 30th, down from 95 per cent on June 30th, and up from 93 per cent at the end of 2018.


Positive equity market performance throughout 2019 and a September rebound in long-term rates prevented a potential 14 per cent decline in the Mercer Pension Health Index at the end of August driven by the lowest yields on long-term bonds in 60+ years. A remarkable drop of 74 basis points in long-term Government of Canada bond yields at the end of August drove a 15 per cent increase in liabilities in 2019.


“Most DB pension plans in Canada weathered the storm over the summer and some came out stronger, but there are worrisome signs on the horizon,” said Andrew Whale, Principal in Mercer Canada’s Financial Strategy Group.


While solvency funded positions have largely held up so far, the ultra-low level of interest rates and uncertainty in the equity markets have significantly lowered the expectations for future long-term asset returns in a typical DB pension plan’s portfolio. This perfect storm will likely result in higher cash and financial reporting costs for many plan sponsors in the coming years. In addition to any existing deficit funding, a DB pension plan with a typical asset mix could face an increase in its current service funding contributions by 15 per cent to 20 per cent based on recent decreases in the expected rates of return.


Inverted yield curves in North America may be a strong indicator to a future recession, adding to negative bond yields in other major economies and uncertainties around trade tensions, Brexit, and slowing global growth. “For plans with long time horizons, earning a level of return that will make the plan affordable and sustainable in this environment will require many to think outside the box,” said Whale. “For those plan sponsors with shorter time horizons, now is an opportunity to consider options to further insulate your plans for the chillier days that may lie ahead.”


“The good news is that many plan sponsors have maintained the strong position that they started with in 2019,” continued Whale. “They should use this as an opportunity to embrace new strategies for the road that lies ahead.”


From An Investment Standpoint


A typical balanced pension portfolio would have risen by 2.1 per cent during the third quarter of 2019. Equity markets advanced with the exception of emerging markets and small caps, while Canadian bonds also rose.


Canadian equity returns were positive in the third quarter. The S&P/TSX Composite Index returned 2.5 per cent. Nine of the eleven sectors posted positive returns with Utilities leading the way, while Health Care dragged.


Canadian fixed income markets rose amidst lower yields for the majority of the quarter, with long-term bonds (2.5 per cent) outperforming universe bonds (1.2 per cent). Real return bonds (1.3 per cent) also rose over the third quarter.


The U.S. equity market returned 1.7 per cent in USD terms (3.0 per cent CAD). Developed market equities were also up, with the MSCI World returning 1.7 per cent in local currency terms (2.0 per cent CAD). Emerging markets were negative in both local currency terms (-1.9 per cent) and Canadian dollar terms (-2.8 per cent CAD).


“Policy uncertainty reached new highs in August and resulted in some significant market volatility as investors reacted to market conditions,” said Todd Nelson, Partner at Mercer Canada. “Although bond yields have increased in September following sharp declines in August, the low yield environment is still very prominent.”


The Bank of Canada held its target for the overnight rate at 1.75 per cent, while the U.S. Federal Reserve cut its target rate by 50 basis points to 2 per cent over the third quarter.


The Mercer Pension Health Index


The Mercer Pension Health Index shows the ratio of assets to liabilities for a model pension plan. The ratio has been arbitrarily set to 100% at the beginning of the period. The new Pension Health Index assumes contributions equal to current service cost plus solvency deficit payments, and no plan improvements. The Mercer Pension Health Index assumes that valuations are filed annually on a calendar year basis and that the deficit revealed in each valuation is funded on a monthly basis over the subsequent five years.


Assets: Passive portfolio. Asset mix for periods up to December 31, 2016 of: 42.5% FTSE/TMX Universe Bond Total Return Index; 25% S&P/TSX Composite; 15% S&P 500 (CAD); 15% MSCI EAFE (CAD); 2.5% FTSE/TMX 91 day T-Bills. Asset mix for periods on or after January 1, 2017 of 42.5% FTSE/TMX Long Bond Total Return Index; 15% S&P/TSX Composite; 40% MSCI World (CAD); 2.5% FTSE/TMX 91 day T-Bills.


Liabilities: 50% active members, 50% retired members. 60% of benefits for active members assumed to be settled through commuted values based on the Canadian Institute of Actuaries transfer value standards without the one-month lag, and the remaining 40% assumed to be settled through an annuity purchase. Benefits for retired members assumed to be settled through an annuity purchase. Annuity prices determined based on the CIA guidance for the medium duration illustrative block. Results will vary by pension plan.


The median solvency ratio of the pension plans of Mercer clients is based on a projection of data within Mercer’s client database. The data and projection methodology were refreshed retroactively at September 30th. The approximate impact of the change in data and methodology was a reduction in median solvency ratio of approximately 2%.


ABOUT MERCER

Mercer delivers advice and technology-driven solutions that help organizations meet the health, wealth and career needs of a changing workforce. Mercer’s more than 23,000 employees are based in 44 countries and the firm operates in over 130 countries. Mercer is a wholly owned subsidiary of Marsh & McLennan Companies (NYSE: MMC), the leading global professional services firm in the areas of risk, strategy and people. With 75,000 colleagues and annualized revenue approaching $17 billion through its market-leading companies including MarshGuy Carpenter and Oliver Wyman, Marsh & McLennan helps clients navigate an increasingly dynamic and complex environment. For more information, visit www.mercer.ca. Follow Mercer on Twitter @MercerCanada.


Contact information